Load Shedding for High Traffic Systems
When running complex distributed systems it's important to balance the cost and service availability. Considering we don't have unlimited hardware at our disposal we usually keep "just right" amount of capacity to serve all users plus some buffer for unexpected traffic spikes.
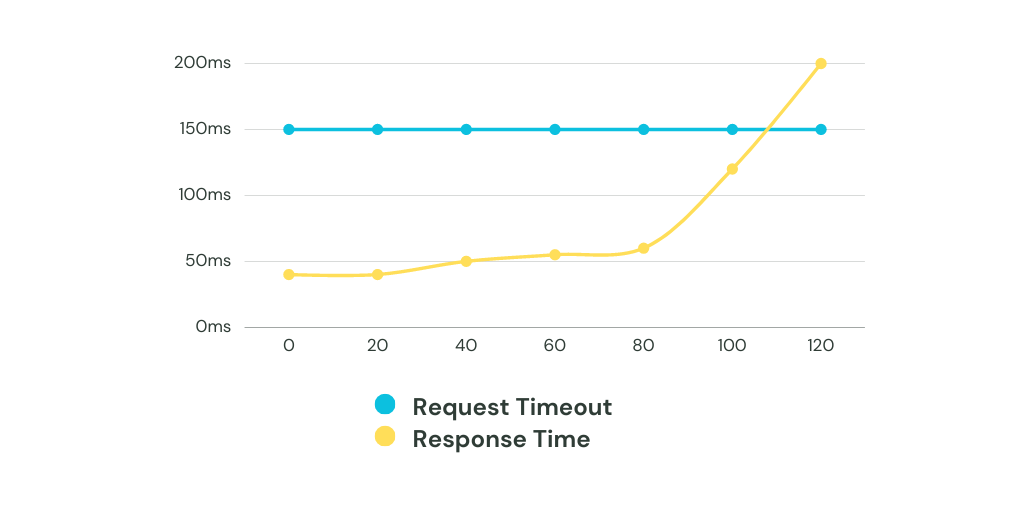
Near full capacity, even small variations in load can degrade performance and availability. Latencies grow, working queue lengths rapidly expand, consumers timeout waiting for responses, and resources become 100% consumed. The system enters a vicious cycle where it is too overloaded to recover (especially if you are using retries).
The solution is building resilience against overload conditions. Systems running hot need "pressure release valves" to shed excess load before it builds to catastrophic levels. This is where the concept of "Load Shedding" comes into picture.
What is Load Shedding?
Load shedding refers to intentionally dropping or even delaying requests when a system becomes overloaded to avoid the full meltdown. The goal of load shedding is to keep an overloaded system operational by selectively discarding some percentage of the traffic. It aims to maximize throughput and minimize response time for priority work when resources are saturated.
Strategies
There are various strategies systems can adopt to shed load and avoid overload conditions:
Random Shedding - self-explanatory, dropping requests randomly to spread the pain across all users.
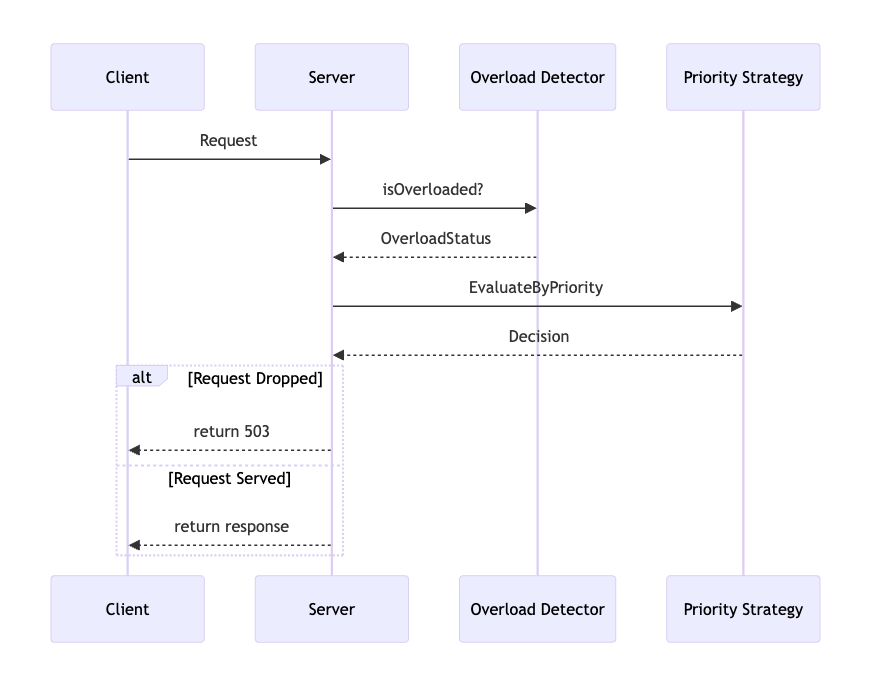
Priority-Based Shedding - Higher priority requests defined by business logic are preserved, while low priority work is shed first. Allows protecting revenue generating transactions (e.g. cart checkouts).
Resource-Based Shedding - Shedding decisions tied dynamically to saturation levels of key resources like CPU, memory, I/O. Avoids overloading any single bottleneck.
Node Isolation - isolate overloaded nodes and block traffic to them so they can recover without bringing down others (e.g. via load balancing techniques).
Implementation
Implementing load shedding requires careful attention to several aspects. First, continuous monitoring of load metrics like request volume, queue length, I/O utilization, memory usage and so on is imperative. This monitoring provides the necessary visibility into load levels and trends that guides intelligent decisions on when to trigger shedding. Defining thresholds on these metrics at which shedding gets activated is important. For example, queue length exceeding 50 requests could trigger shedding. Policies can consider multiple variables too, like a combination of high queue length AND I/O utilization.
The next key part is the logic that actually delays or drops requests to reduce load when shedding is activated. This shedding function needs to be efficiently implemented in code at points where it can best interact with queues, incoming requests etc to rapidly dampen load. The selection of which specific requests get shed has to be carefully considered - common techniques look at priorities, randomness, resource usage patterns etc to maximize shedding's positive impact while maintaining fairness.
Another central concern is properly configuring the frequency and duration of shedding events. Shedding too often causes excessive disruption while shedding too rarely allows spikes to persist. Similarly, shedding duration must be enough to restore equilibrium but not so long that it creates an availability bottleneck. Fine tuning these timing parameters is crucial. Signaling shed requests helps clients gracefully handle them via retries or fallback logic rather than experiencing silent failures.
It's also important that the shedding system works in concert with auto scaling to quickly spin up more capacity in parallel. Load shedding and scaling together help smoothly handle spikes. Monitoring shedding efficacy with metrics and logs helps inform tuning the policies and thresholds. Overall, implementing intelligent, cloud-ready load shedding requires bringing together metrics monitoring, policy definitions, timing configurations, signaling/retries and scale out capacity - all carefully calibrated to the needs of the workload and system architecture.
Let's build a simple implementation of load shedding in Golang:
package main

import (
	"fmt"
	"log"
	"net/http"
	"sync/atomic"
	"time"
)

var isOverloaded atomic.Bool

const OverloadFactor = 1010

func overload_detector_worker(startTime time.Time) {
	elapsed := time.Since(startTime)
	fmt.Printf("Goroutine launched after %v\n", elapsed)
	if elapsed > OverloadFactor*time.Millisecond {
		fmt.Printf("Overload detected after %v\n", elapsed)
		isOverloaded.Store(true)
	} else {
		isOverloaded.Store(false)
	}

}

func handler(w http.ResponseWriter, r *http.Request) {
	if isOverloaded.Load() {
		w.WriteHeader(http.StatusServiceUnavailable)
		fmt.Fprint(w, "Service is overloaded, please try again.")
	} else {
		fmt.Fprint(w, "Processed!")
	}
}

func main() {
	ticker := time.NewTicker(1 * time.Second)
	defer ticker.Stop()

	startTime := time.Now()
	go func() {
		for {
			<-ticker.C
			go overload_detector_worker(startTime)
			startTime = time.Now()
		}
	}()

	http.HandleFunc("/", handler)
	log.Fatal(http.ListenAndServe(":8080", nil))
}
This Go code implements a basic load shedding mechanism by detecting request overload conditions and responding with an HTTP 503 status code. Here is an explanation:
isOverloadedis an atomic Boolean value indicating overload stateoverload_detector_workergoroutine runs every 1 second to check for overloadIt measures time elapsed since
startTimeIf elapsed time is greater than threshold of 1010 ms, it sets
isOverloadedto trueThis means the last request took over 1 second, indicating overload
The handler function checks
isOverloadedvalue on each requestIf true, it returns HTTP 503 status code and overload message
Otherwise it processes request normally
If you stress test this code with bombardier framework within a limited resource environment (e.g. docker with cpu limit), you should start seeing:
Goroutine launched after 1.001029209s
Goroutine launched after 999.614834ms
Goroutine launched after 1.00093325s
Goroutine launched after 1.00170125s
Goroutine launched after 998.171418ms
Goroutine launched after 1.100508334s
Overload detected after 1.100508334s
Goroutine launched after 898.383584ms
Goroutine launched after 1.001621292s
Goroutine launched after 1.096664417s
Overload detected after 1.096664417s
And in the sample test it will shed some percentage of traffic and will return 503s to the client
$ bombardier -c 125 -n 100000 http://127.0.0.1:8080/                                                                                                                                                             ─╯
Bombarding http://127.0.0.1:8080/ with 100000 request(s) using 125 connection(s)
 100000 / 100000 [============================================================================================================================================================================] 100.00% 1299/s 1m16s
Done!
Statistics        Avg      Stdev        Max
  Reqs/sec      1315.79    2099.54   20333.67
  Latency       96.05ms    58.83ms   802.30ms
  HTTP codes:
    1xx - 0, 2xx - 76888, 3xx - 0, 4xx - 0, 5xx - 23112
    others - 0
  Throughput:   253.69KB/s
Priority-Based Shedding
In order to be able to utilize Priority-Based Shedding you would need to introduce "Request Taxonomy". A great article from Netflix illustrates how they categorize requests going through the services:
Non-critical - type of traffic that's not related or critical to the core business logic. It often includes background requests and logs. While these requests might seem secondary, they often account for a substantial amount of the system's overall load due to their volume.
Degraded-experience - traffic in this category can influence the quality of the user experience without affecting primary functionalities. Features such as user preferences, markers indicating activity, and history tracking, rely on this type of traffic.
Critical - disruptions in this traffic category compromise essential functionalities. Users will encounter errors when trying to access core features if these requests are not properly handled.
This taxonomy allows "rational shedding" - low priority requests are shed under load before impacting higher priority ones. One of the options to propagate the priority of a particular request is using a custom HTTP request header, e.g. "X-Priority".
Conclusion:
In distributed systems, building resilience is not just about handling failures, but also about preemptively managing resources and traffic to prevent failures in the first place. Load shedding, especially when combined with request prioritization, becomes a handy tool in the arsenal of system designers to ensure high availability and a satisfactory user experience.
🔥 Improve your code reviews with our new Code Review Checklist. Download it now for free to ensure your reviews cover all the key areas like readability, functionality, structure and more.


