What is a Memory Leak?
Though subtle at first, memory leaks can severely degrade system performance and stability, resulting in sluggish behavior, crashes, or freezing. They occur due to programming oversights like forgetting to deallocate memory or retaining references to deleted objects.
Tackling memory leaks head-on is a crucial skill for any programmer seeking to build reliable, optimized software.
In this post will look into:
Understanding memory Leaks.
Common Causes of memory leaks.
Tools and Techniques for Detecting Memory Leaks.
Understanding Memory Leaks
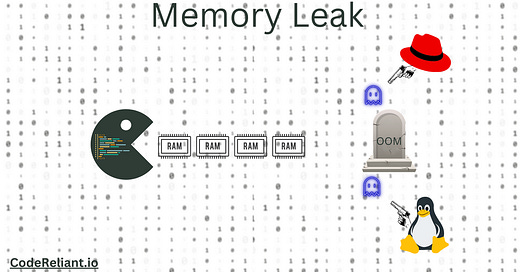
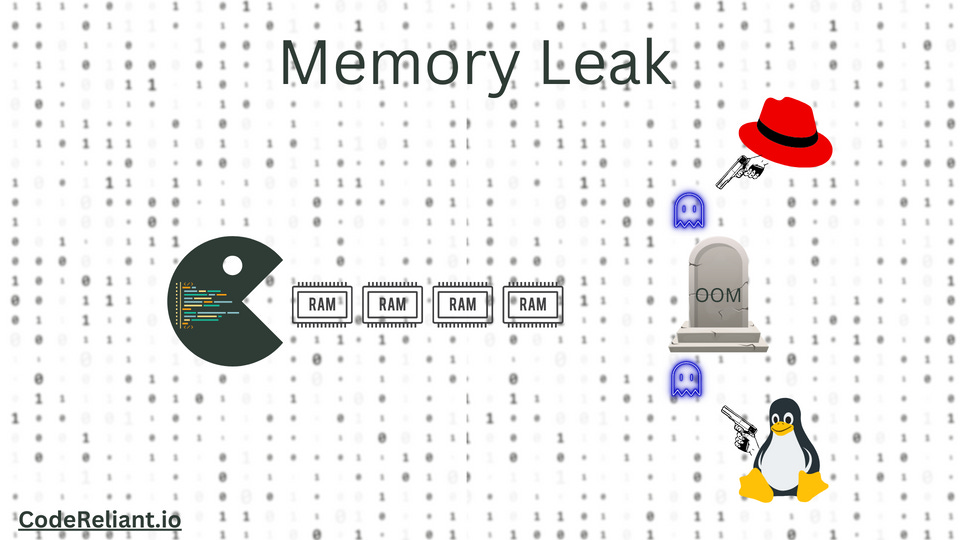
A memory leak refers to a specific type of unintentional memory consumption by a computer program where the program fails to release memory that is no longer needed or used. This phenomenon occurs when objects in memory are no longer being used by the application, but the allocated memory isn't returned to the operating system or the memory pool.
Consuming memory without releasing it leads to unintended consequences for systems and it can significantly degrade systems performance in the following ways:
Increased memory usage: As more memory is leaked and not released, overall system memory usage rises. This leaves less memory available for other processes and applications, slowing down the system.
Increased paging: As memory leaks accumulate, the system may start swapping memory contents to disk to free up RAM, resulting in more disk I/O. This leads to slower performance as disk operations are much slower than memory operations.
Out of memory errors: With enough memory leaks, the system may eventually run completely out of available memory. This can lead to crashes, failed memory allocations, and programs being terminated.
Resource contention: Higher memory usage also leads to more contention for cache and resources like CPU time as the system tries to manage limited resources. This further slows down performance.
Application instability: Applications with memory leaks may experience crashes, unexpected behaviors, and intermittent failures as their memory usage grows over time. This leads to instability and reliability issues.
Security risks: Memory leaks leave data lingering in memory longer than intended. This data could contain passwords, keys, or other sensitive information that poses a security risk if accessed by malware or attackers.
Proactively detecting and fixing memory leaks is important to maintain high performance and stability for systems and applications. Letting memory issues linger can snowball into much larger systemic problems in the long run.
Common Causes of Memory Leaks
Memory leaks can arise from various sources, depending on the programming language, platform, and specific application scenarios. Here are some of the most common causes:
Unclosed Resources: Failing to close resources such as files, database connections, or network sockets can lead to memory leaks. These resources, if left open, can accumulate over time and consume significant memory.
Unreleased Object References: Holding onto object references that are no longer needed can prevent garbage collectors (in languages that have them) from reclaiming the memory.
Cyclic References: In some languages, two objects referencing each other can lead to a situation where neither can be garbage collected, even if no other part of the program references them.
Static Collections: Using static data structures that grow over time without ever being cleared can lead to memory leaks. For instance, adding elements to a static list without removing them can cause the list to grow indefinitely.
Event Listeners: Not detaching event listeners or callbacks can lead to memory leaks, especially in environments like web browsers. If an object is attached to an event but is no longer in use, it won't be garbage collected because the event still holds a reference to it.
Middleware and Third-party Libraries: Sometimes, the cause of a memory leak might not be in the application code but in the middleware or third-party libraries it uses. Bugs or inefficient code in these components can lead to memory leaks.
Improper Memory Management: In languages where developers manually manage memory (e.g., C, C++), failing to deallocate memory after use or using "dangling pointers" can result in leaks.
Memory Fragmentation: While not a leak in the traditional sense, fragmentation can lead to inefficient memory usage. Over time, small gaps between memory allocations can accumulate, making it difficult to allocate larger blocks of memory.
Orphaned Threads: Threads that are spawned but not properly terminated can consume memory resources. These orphaned threads can accumulate over time, especially in long-running applications.
Cache Overuse: Implementing caching mechanisms without proper eviction strategies can lead to memory being consumed indefinitely, especially if the cache keeps growing without bounds.
Example of Unclosed Resources:
One of the most common unclosed resources in Go that can lead to a memory leak is an unclosed file. Here's a simple example:
package main

import (
	"fmt"
	"os"
)

func main() {
	for i := 0; i < 1000; i++ {
		file, err := os.Open("somefile.txt")
		if err != nil {
			fmt.Println("Error opening file:", err)
			return
		}

		// Do something with the file, e.g., read a line
		// But forget to close the file

		// This should be present to prevent the leak:
		// file.Close()
	}
}
In the above code, we're opening a file somefile.txt 1000 times in a loop but forgetting to close it. Each time the file is opened, a file descriptor is allocated, and since we're not closing it, these descriptors accumulate, leading to a resource leak.
To fix this, you should always ensure that resources like files are closed after their use. The defer statement in Go can be particularly useful for this:
file, err := os.Open("somefile.txt")
if err != nil {
    fmt.Println("Error opening file:", err)
    return
}
defer file.Close()
With the defer statement, the file.Close() method will be called automatically when the surrounding function (main in this case) exits, ensuring that the file is always closed.
Tools and Techniques for Detecting Memory Leaks
Detecting memory leaks can be challenging, but with the right tools and techniques, developers can identify and address these issues more efficiently. Here's a rundown of popular tools and methodologies:
Profiling Tools:
Valgrind: An instrumentation framework for building dynamic analysis tools, with a suite called Memcheck that can detect memory leaks in C and C++ programs.
Java VisualVM: A monitoring, troubleshooting, and profiling tool for Java applications.
.NET Memory Profiler: A tool for finding memory leaks and optimizing the memory usage in .NET applications.
Golang pprof: a tool lets you collect CPU profiles, traces, and heap profiles for your Go programs. (Debug Golang Memory Leaks)
Browser Developer Tools: Modern web browsers like Chrome, Firefox, and Edge come with built-in developer tools that can help identify memory leaks in web applications, especially in JavaScript.
Static Analysis: Tools like Lint, SonarQube, or Clang Static Analyzer can scan code to identify patterns that might lead to memory leaks.
Automated Testing: Incorporating memory leak detection into automated testing can help catch leaks early in the development cycle. Tools like JUnit (for Java) or pytest (for Python) can be integrated with memory analysis tools to automate this process.
Heap Analysis: Examining the heap dump of an application can provide insights into objects that are consuming memory. Tools like Eclipse MAT (Memory Analyzer Tool) or Java Heap Analysis Tool (jhat) can assist in this analysis.
Metrics: Implementing metrics to monitor memory usage over time can help in identifying patterns or specific operations that lead to increased memory consumption.
Garbage Collection Logs: In languages with garbage collection, analyzing GC logs can provide clues about potential memory leaks. For instance, if the garbage collector is running frequently but recovering little memory, it might indicate a leak.
Third-party Libraries and Middleware: Some third-party solutions offer built-in memory leak detection capabilities. It's essential to check the documentation or forums related to these components if you suspect they might be the source of a leak.
Manual Code Review: Sometimes, the best way to identify a memory leak is through a thorough manual review of the code, especially in areas where memory is allocated and deallocated.
Stress Testing: Running the application under heavy load or for extended periods can help expose memory leaks that might not be evident under normal conditions.
Example of Java Stress Testing & Profiling:
Java Microbenchmark Harness (JMH) is a Java library for benchmarking the performance of code. While JMH is primarily used for performance benchmarking rather than detecting memory leaks, you can use it in conjunction with profiling tools to observe memory consumption under stress.
Here's a simple example using JMH to stress test a method, and then you can use a tool like VisualVM or YourKit to monitor memory usage during the benchmark:
First, add the JMH dependencies to your pom.xml (if you're using Maven):
<dependency>
    <groupId>org.openjdk.jmh</groupId>
    <artifactId>jmh-core</artifactId>
    <version>1.23</version>
</dependency>
<dependency>
    <groupId>org.openjdk.jmh</groupId>
    <artifactId>jmh-generator-annprocess</artifactId>
    <version>1.23</version>
    <scope>provided</scope>
</dependency>
Then, write the benchmark:
import org.openjdk.jmh.annotations.*;

import java.util.ArrayList;
import java.util.List;
import java.util.concurrent.TimeUnit;

@State(Scope.Thread)
@BenchmarkMode(Mode.AverageTime)
@OutputTimeUnit(TimeUnit.MICROSECONDS)
public class MemoryLeakBenchmark {

    private List<String> items;

    @Setup
    public void setup() {
        items = new ArrayList<>();
    }

    @Benchmark
    public void testMethod() {
        for (int i = 0; i < 1000; i++) {
            items.add(new String("Item " + i));
        }
        // Intentionally not clearing the list to simulate a memory leak
        // items.clear();
    }

    public static void main(String[] args) throws Exception {
        org.openjdk.jmh.Main.main(args);
    }
}
$ mvn clean install
$ java -jar target/benchmarks.jar
While the benchmark is running, use a profiler like VisualVM to monitor the heap usage. If there's a memory leak in the testMethod, you'll observe a continuous increase in memory consumption.
Remember, JMH itself won't detect the memory leak. It's just a tool to stress test the method. The actual detection of the memory leak will be done using a profiler or memory analysis tool.
Conclusion
Memory leaks are a critical concern in software development. They can affect an application's performance and lead to bad user experience. However, with a clear understanding of their causes and armed with the right tools and techniques, developers can effectively identify and address these issues.As we've explored in this guide, proactive measures, regular monitoring, and continuous learning are the keys to ensuring your applications remain leak-free. By staying informed you can ensure that memory leaks become a problem of the past, paving the way for optimized, efficient, and reliable software solutions.


